|
Bot Libre now supports bot analytics and charts for chat and social media.
Analytics provide statistical data on how well your bot is performing, including analytics such as engaged conversations, user sentiment, and response confidence.
You can now view your bot's analytics for various date ranges as a chart or as data in the table. This newly introduced feature allows you to see how popular your bot is, and compare your bot to other bots using analytics. You can access your bot's analytics page from the bot's 'Admin Console' by clicking on the 'Analytics' link.
To view the bot's analytics chart simply select the media type from 'Chart' drop down select box. By default you'll see your bot's analytics chart for the current week. However, you can view your bot's analytics chart for duration period of either day, week, month, or everything. You can also group your bot's analytics either by day, week, or month using 'Group By' drop down select box. 'Group By' select enables you to view your bot's analytics chart for a given duration period as cumulative set of points. The grouping of data points makes the bot's general analytic trend direction more apparent. After selecting the media type chart, duration and group, you can then view or hide a particular bot's statistic by checking or unchecking the check box beside each analytic name.
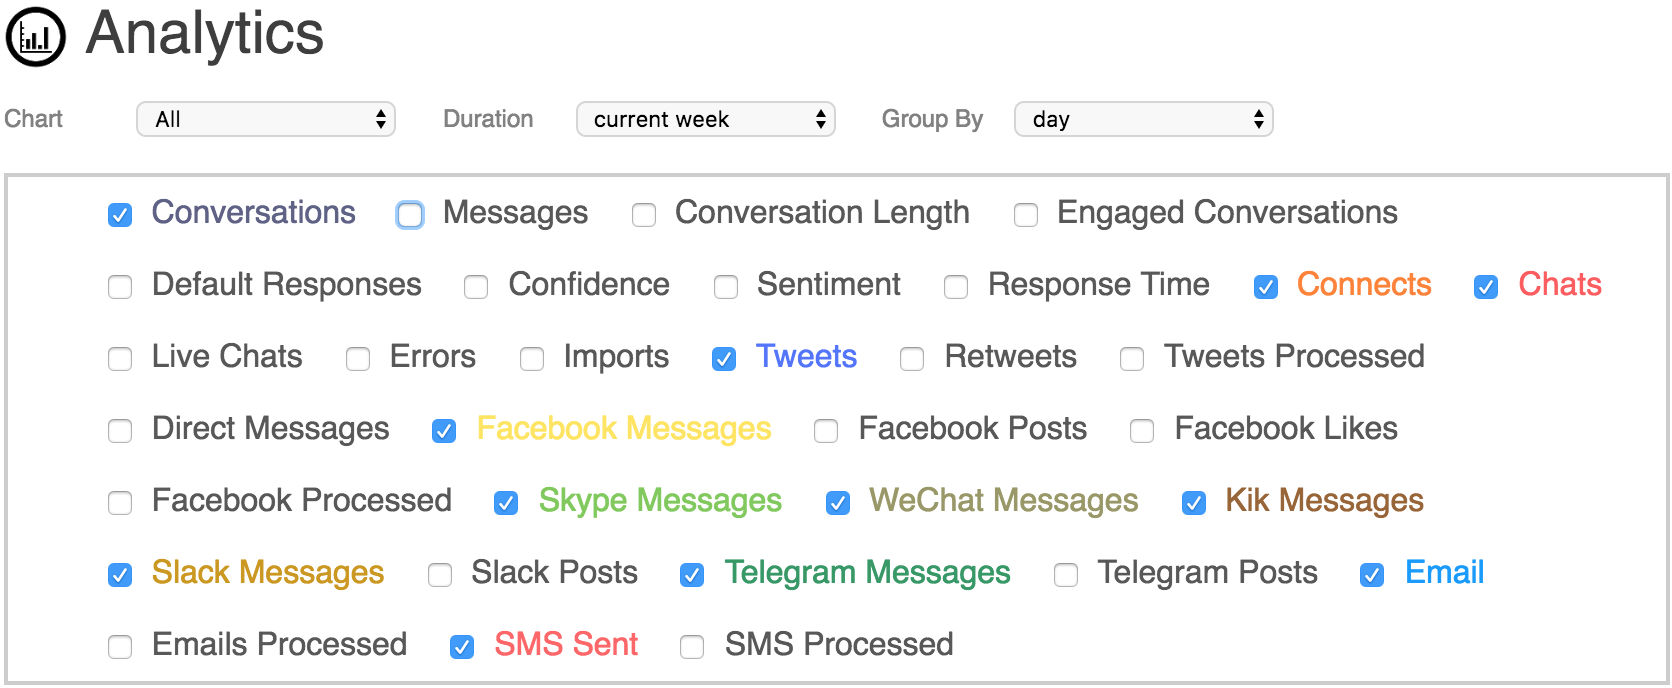
Figure 1: Analytic Options
Figure 1 shows all analytics for every social media type. Note that the colour of analytic name beside each check box corresponds to the colour of each analytic curve on the chart. Also note that in some circumstances you may see less analytics curves on the graph than the analytic name checks. This is because some curves are plotted on top of other analytics curves because their data point sets are identical.
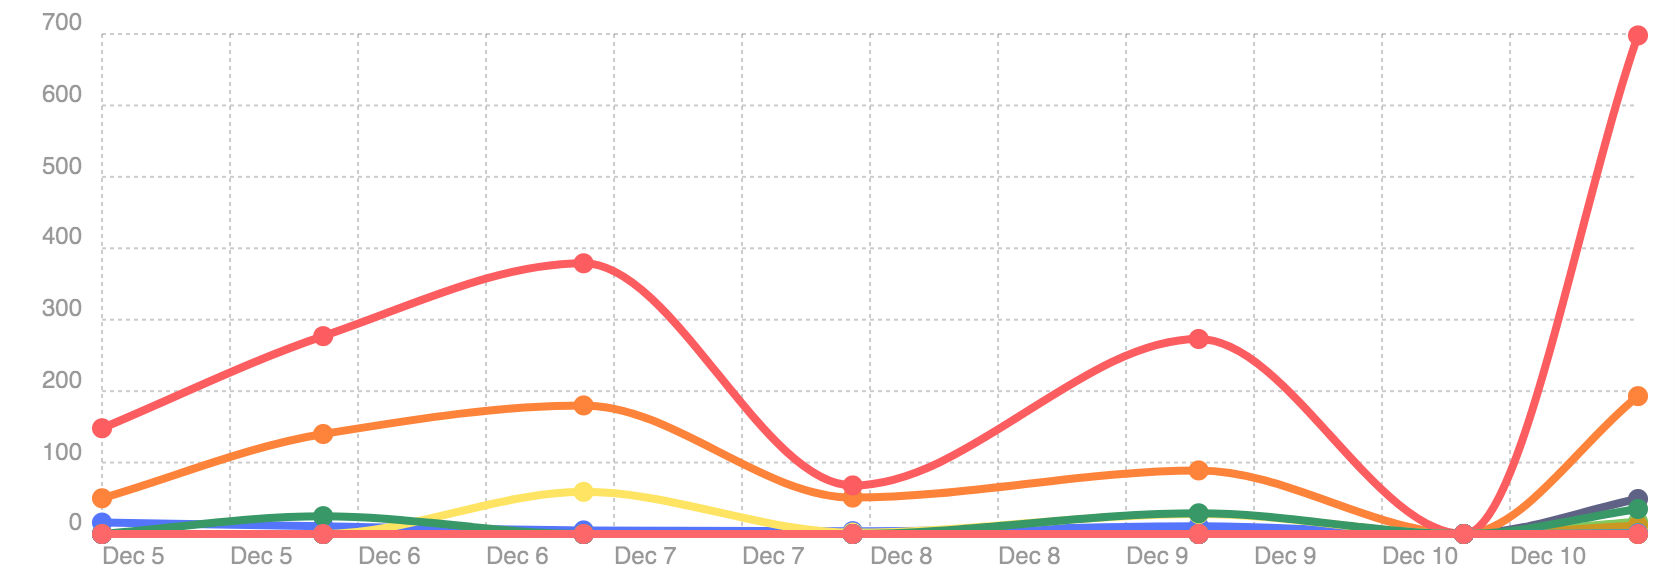
Figure 2: Analytics Chart for Social Media
Figure 2 shows graphs of selected bot's analytic for 'All' social media types. Note that the number of analytic curves is less than the number of checked bot's analytics because some curves have the same data points and hence overlay each other.
Analytics
Bot Libre provides many different analytics to help you monitor your bot's effectiveness in chat and social media.
Analytics for tracking conversations, messages, engaged conversations, conversation length, sentiment, and confidence are available.
| Analytic | Description |
|---|
| Conversations | Total conversations the bot had for all chat and social media platforms. | | Messages | Total messages the bot had for all chat and social media platforms. | | Conversation Length | Total conversation length the bot had for all chat and social media platforms. | | Engaged Conversations | Total number of conversations that bot had with at least three messages. | | Default Responces | Total number of messages the bot did not find an answer for. When the bot does not know a response to a question, it
uses its 'default' response. | | Confidence | Avarage confidence the bot had on its responses based on the user question and the bot's matching trained question.
Exact question matches and pattern matches are considered to be 100%, and default responses are 0%. | | Sentiment | User's average sentiment or emotion to the bot's responses, either good or bad. If the user's questions seem very
happy the sentiment will be 100%. If the user seems very unhappy the sentiment will be -100%. If the user did not
express any emotion, then the sentiment will be 0%. | | Connects | Total number of times a user or admin connected to the bot through the web or mobile. | | Chats | Total number of chats that the bot had. | | Live Chats | Total number of live chats that the bot had. | | Errors | Total number of errors the bot had while responding to chats. | | Response Time | How long it took the bot to respond the the user's message for chat and all social media platforms. | | Imports | Total number of scripts or response lists imported into the bot. | | Tweets | Total number of tweets the bot posted for Twitter social media. | | Retweets | Total number of retweets the bot has made for Twitter social media. | | Tweets Processed | Total number of tweets bot has read. | | Direct Messages | Total number of private, user to user chat message for Twitter social media. | | Facebook Posts | Total number of Facebook posts the bot has made for Facebook social media. | | Facebook Likes | Total number of Facebook posts that bot 'likes'. | | Facebook Messages | Total number of Facebook posts processed by the bot for Facebook social media. | | Facebook Messages Processed | Total number of Facebook messages that the bot has read for Facebook social media. | | Skype Messages | Total number of Skype messages the bot has read. | | Kik Messages | Total number of Kik messages the bot has read. | | WeChat Messages | Total number of WeChat messages the bot has read. | | Slack Messages | Total number of Slack messages the bot has read. | | Slack Posts | Total number of Slack posts the bot has made for Slack social media. | | Telegram Messages | Total number of Telegram messages the bot has read. | | Telegram Posts | Total number of Telegram posts the bot has made for Telegram social media. | | Email | Total number of emails the bot has sent. | | Emails Processed | Total number of emails the bot has read. | | SMS Sent | Total number of SMS messages the bot has sent. | | SMS Processed | Total number of SMS messages the bot has read. |
Bot Analytics Table

Figure 3: Bot Analytics Table
Figure 3 shows the same bot's analytics data point as graphs above, but only inside a table.
If you encountered any issues, or would like help setting up your bot please email us at [email protected] or upgrade to our Platinum service and we can build your bot for you.
|